Home»Dashboards»Dashboard 202 | CLV to CAC Ratio Analytics | RevOps
Dashboard 202 | CLV to CAC Ratio Analytics | RevOps
Offering(s):
Revenue Operations
Prebuilt Solution:
Yes
Analytic(s):
CAC Reduction, Churn
Dashboard Summary
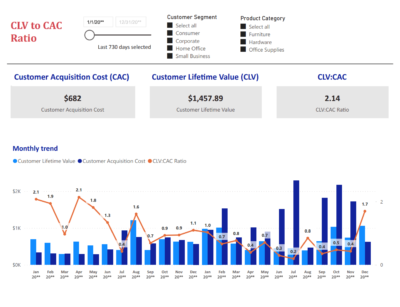
This dashboard tracks the CLV to CAC ratio by channel and customer group. It shows if customer value is high enough to cover acquisition cost. Use it to spot healthy vs risky segments. Filter by date, channel, region, or plan to compare performance.
7 W 41 Ave. #339 San Mateo, CA 94403 1-618-458-0137
Services
Resources
About
7 W 41 Ave. #339 San Mateo, CA 94403 1-618-458-0137
Subscribe to our newsletter
By submitting this form you are agreeing to the terms laid out in the GainOps Privacy Policy. We will send you our newsletter and/or updates on a periodical basis, and you can opt out at any time in the future.
We use cookies essential for this website to function well. Please click "Accept" to help us improve its usefulness with additional cookies. Learn about our use of cookies and collaboration with select social media and trusted analytical partners here.