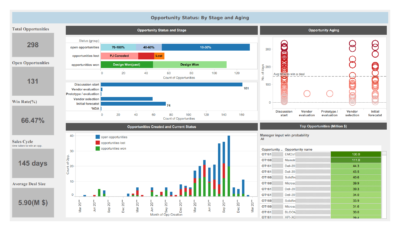
On the left, the dashboard shows sales opportunity metrics. Use them to check how well your team handles deals.
The Opportunity Status and Stage chart breaks down how many opportunities sit in each sales stage. The Opportunity Aging chart shows pipeline health. It highlights deals that stay too long in one stage. Your team can spot stuck deals and push them forward. For example, select the 40–60% status to find deals in the discussion stage for 100+ days. Remove these time delays to keep the pipeline moving.
The Top Opportunities chart helps you focus on the best deals. It shows which opportunities are most likely to close and bring in more revenue.