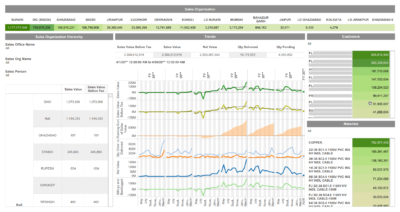
This dashboard helps you monitor sales orders from all angles. The top band shows total sales orders by office location. The graph on the left shows each territory and rep’s share of total sales value. Click the graph to see more detail, such as performance by material and customer. Use the filters to get a 360-degree view of sales orders.