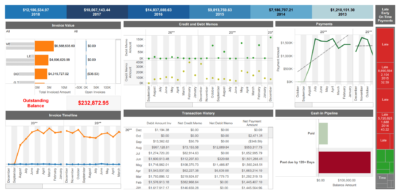
This report gives up-to-date customer information in one place. The top band shows total revenue by year. The graph on the left shows each customer’s share of total revenue. To view one year, click a year in the top band. The report then updates the numbers in every section.
Click any graph to filter the other graphs. This filtering gives a 360-degree view of customer data. It also helps you spot areas that need attention.