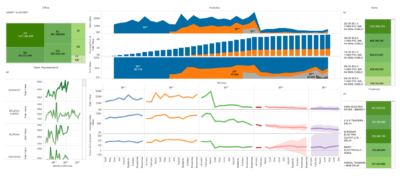
This is a sales report by sales office and rep. The graph on the left shows each office’s share of total revenue. The chart at the bottom left shows each rep’s sales trend. Click any office or rep to see sales trends for the selected name. You will also see the related items and customers.