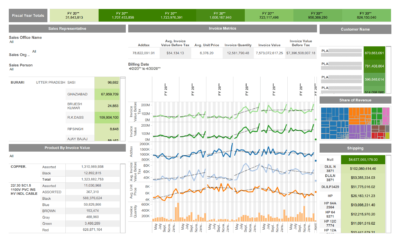
This dashboard monitors invoice and revenue performance from all angles. First, the top band shows total revenue by year. Next, the chart on the left shows each rep’s contribution to total revenue.
To view a specific year, click the year in the top band. Then, the numbers will recalculate across all other sections of the report. In addition, every chart on the dashboard is clickable. As a result, you can filter the other charts using the built-in filtering tools. This provides a full 360-degree view of sales.